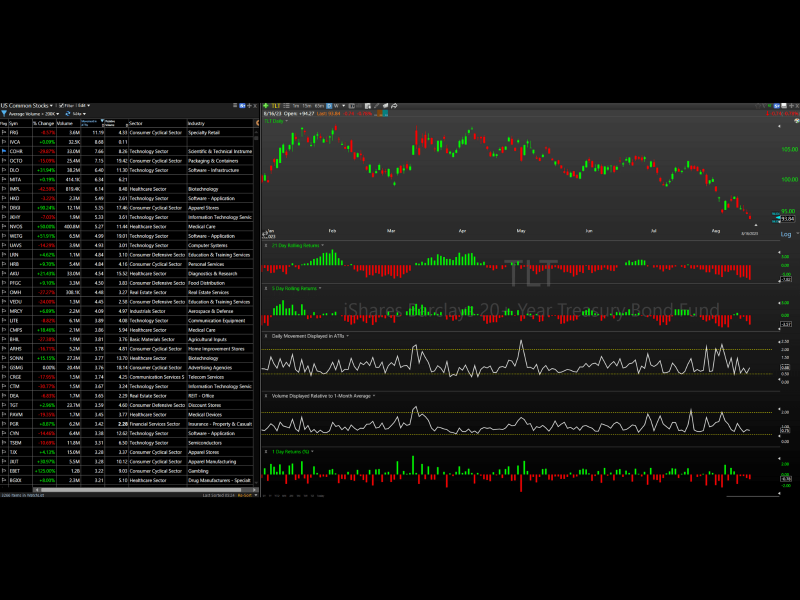
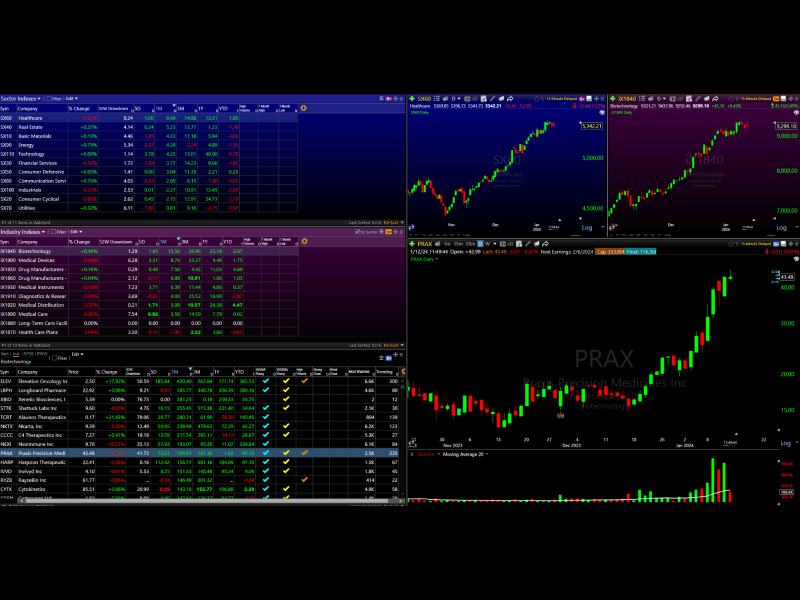
TC2000 Relative Strength Layout
$79.00
The TC2000 Relative Strength Layout will help you quickly and easily identify the best-performing segments of the market, relative to the S&P500 or key benchmark.
Description
Forget about whether or not something is up or down on the week, month, or year. Instead, ask yourself how it’s doing relative to the benchmark. If something is up, but the S&P500 is up twice as much, wouldn’t you rather have just owned the SPY?
Relative strength charts display a simple line that plots a stock’s performance compared to a benchmark index. These charts allow traders to clearly see how their chosen stock is trending relative to the benchmark’s performance.
How it works
This purchase includes two layouts for you to visualize market leadership and strength across a variety of important ETFs.
The first layout contains relative strength charts for all SPDR sector ETFs plotted against the S&P 500. These line charts show relative performance, not the absolute performance of the sectors themselves. Below each chart, we’ve included a 3-month rolling return indicator based on the ratio chart returns.
A positive 3-month return indicates that the sector has generated excess returns over the benchmark.

You’ll also receive a second layout that displays a grid of six relative strength charts looking specifically at the following ratios:
- Small cap stocks VS large caps stocks
- Growth stocks VS value stocks
- High beta stocks VS low beta stocks
- Semiconductors VS the S&P500
- High yield bonds VS 10-Y Treasury
- Emerging markets VS the S&P500
Each of those ratios tell you important information about the state of the current market environment. There’s a lot more to say about those ratios and this layout so we recommend you watch the following demonstration video to get more details.
Requirements
- An active TC2000 Premium or Premium+ subscription is required to use this layout
How to use this layout
There are many ways to incorporate the TC2000 Relative Strength Layout, some of which include:
- Easily identify the strongest and weakest relative sectors in the stock market
- Easily identify the factors that are leading and lagging in the stock market
- Watchlist curation and trade idea generation
Features
- Easy to install — no need to touch any code
- Enjoy 18 different pre-built ratio charts with rolling returns indicator
- Can be used on all versions of TC2000 (Version 20+ required for line coloring)
Please note: all sales are final. This is an instant digital download and you will receive the source code immediately upon purchase. We encourage you to contact us prior to check out if you have any questions about this layout. Thank you for your understanding!
Related products
-

TC2000 Sector & Industry Layout
$79.00
The TC2000 Sector and Industry Layout is a fast and efficient way to highlight groups of stocks in the market that are making noteworthy moves. Learn more.
Add to cart -
TC2000 Rolling Returns Layout
$79.00
The TC2000 Rolling Returns Layout is designed to help you quickly size up stocks, identify meaningful moves, and uncover potential exhaustion points. Learn more.
Add to cart -
TC2000 New IPO Stocks Layout
$79.00
The TC2000 New IPO Stocks Layout is the perfect solution for traders who want to track and trade the latest stocks hitting the public market. Learn more.
Add to cart -
TC2000 Strongest & Weakest Stocks Layout
$79.00
The TC2000 Strongest & Weakest Stocks Layout will help you efficiently identify stocks that have been performing best over recent days, weeks, & months. Learn more.
Add to cart